
01 / Project overview
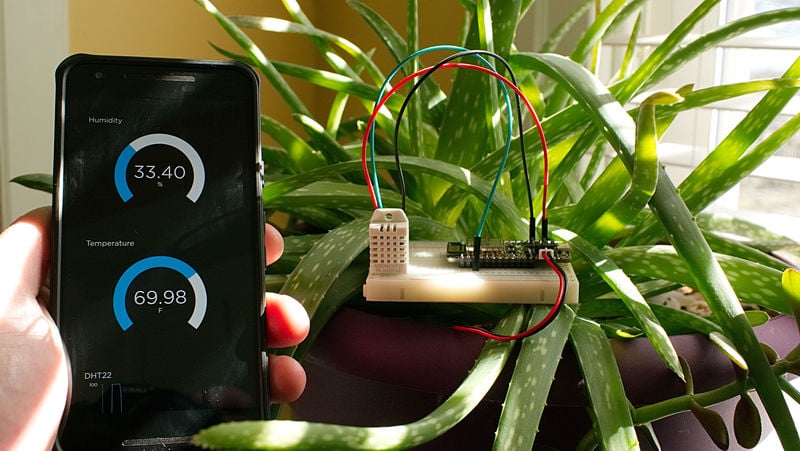
A small dashboard is a good way to learn the path from sensor to network feed to display. Adafruit’s temperature and humidity guide provides a DHT22-based starting point. Choose a board supported by the relevant version of its example and check current library requirements before installing.
02 / Materials & software
| Item | What to check |
|---|---|
| DHT22 sensor | Check whether your module already includes the required pull-up. |
| Supported networked board | Follow its voltage and pin requirements. |
| Adafruit IO account | Create dedicated test feeds. |
| Breadboard and data cable | Keep wiring accessible during the first test. |
03 / Connections & first setup
Use the sensor guide’s data, power, ground, and pull-up arrangement for the chosen board. Sensor supply voltage and GPIO logic limits are separate checks. Keep API credentials in a local secrets file and exclude that file from shared project folders.
04 / Build the project
- Prove local readings
Print sensor readings without any network code. Confirm units and handle a failed read. Do not publish a made-up value when the library reports a sensor error.
- Create two feeds
Use separate, clearly named feeds for temperature and humidity. Publish one known test value to each and check the dashboard receives it. This isolates account and feed configuration from sensor wiring.
- Connect the pipeline
Replace fixed values with real readings. Set an interval compatible with the sensor and service limits. A faster loop does not necessarily produce newer or more accurate measurements.
- Show freshness
Display when the latest value arrived. Decide what should happen after several missed updates. A graph should show missing data as a gap instead of silently implying the last measurement remains current.
- Test recovery
Disconnect Wi-Fi briefly and restore it. The device should reconnect without repeatedly flooding the service. Keep a short local error log so authentication, network, and sensor failures can be distinguished.
Suggested feed contract
room-temperature: value in degrees C
room-humidity: value in percent RH
Measurement failure: skip value and record the error
Stale display: show last update time
05 / Check the result
| Check | Expected behavior |
|---|---|
| Local sensor | Readings are plausible before publishing. |
| Feed mapping | Temperature and humidity reach the correct widgets. |
| Offline period | A gap or stale indicator is visible. |
Troubleshooting. If local readings work but feeds do not, check names and credentials before changing the sensor. If the dashboard seems frozen, compare its latest timestamp with serial output. Keep the sampling interval and publishing interval explicit in the project notes.
06 / Sources & build notes
Prepared by PineMux from the official sources above. These are editorial build instructions; this project has not been bench-tested by PineMux. The cover shows reference hardware or a source project; image credit is provided above. Use the manufacturer’s revision-specific diagrams for exact wiring.