
01 / Project overview
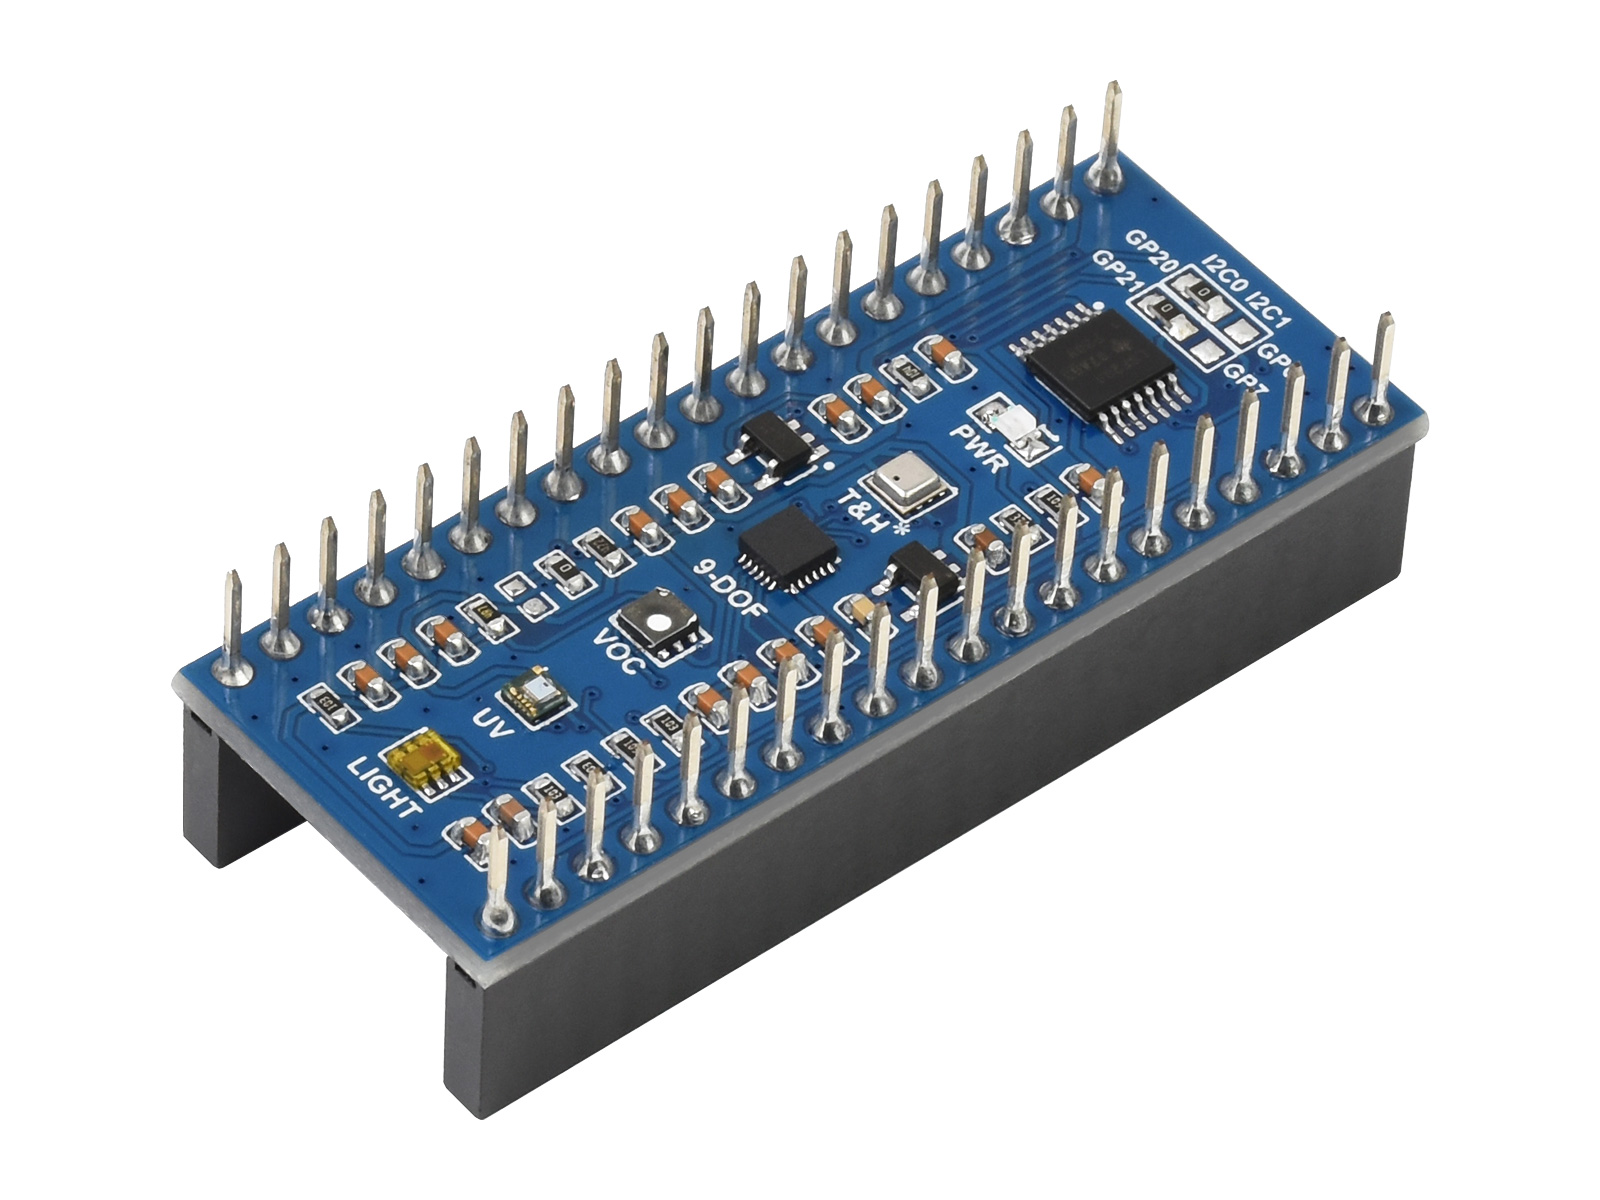
The Pico-Environment-Sensor combines several I2C devices, including a BME280, TSL2591-family light sensor, and SGP40. A first project can show temperature, humidity, and light, then add the SGP40’s processed VOC signal. A VOC trend is not a CO2 measurement or a complete air-quality assessment.
02 / Materials & software
| Item | What to check |
|---|---|
| Pico Environment Sensor | Check the exact module and example package. |
| Raspberry Pi Pico | Use the firmware expected by that package. |
| USB data cable | Keep development wired. |
| Serial console or small display | Start with serial output before adding another screen. |
03 / Connections & first setup
Fit the module in the correct Pico header orientation with power off. Use the pin assignments from the module demo for its shared I2C bus. Check addresses before attaching additional sensors; another device at the same address can prevent reliable communication.
04 / Build the project
- Bring up one channel
Run the manufacturer’s BME280 example first. Confirm temperature, humidity, and pressure units. Keep these values separate from any temperature used internally by another sensor.
- Add a light reading
Read the light sensor and compare the result with the sensor covered and uncovered. Record the configured gain or integration settings. A saturation condition should be reported rather than displayed as an ordinary maximum.
- Introduce the VOC channel
Use the sensor library’s supported processing and stabilization procedure. Preserve the manufacturer’s timing requirements. Label the result according to the algorithm output instead of converting it to an invented CO2 value.
- Create a compact record
Give every channel a name, unit, and freshness state. Keep sensor failures independent. If a driver returns an error, show unavailable for that channel while the rest of the monitor continues.
- Compare trends
Collect a normal room baseline, then note ordinary changes such as opening a window. Interpret correlated trends cautiously. Keep the monitor as an educational instrument and avoid presenting it as a calibrated safety alarm.
Display fields
Temperature: C
Humidity: % RH
Light: lux or explicitly labeled raw output
VOC: label supplied by the chosen processing library
Updated: elapsed time or a real timestamp
05 / Check the result
| Check | Expected behavior |
|---|---|
| Light response | Covering the sensor produces a clear change. |
| Channel failure | Only the failed channel becomes unavailable. |
| VOC label | No CO2 or health claim is inferred from the signal. |
Troubleshooting. A combined program may fail because two libraries initialize the same bus differently. Return to the individual demos and integrate one device at a time. Keep library timing intact; a faster polling loop can make a processed sensor output less useful.
06 / Sources & build notes
Prepared by PineMux from the official sources above. These are editorial build instructions; this project has not been bench-tested by PineMux. The cover shows reference hardware or a source project; image credit is provided above. Use the manufacturer’s revision-specific diagrams for exact wiring.