
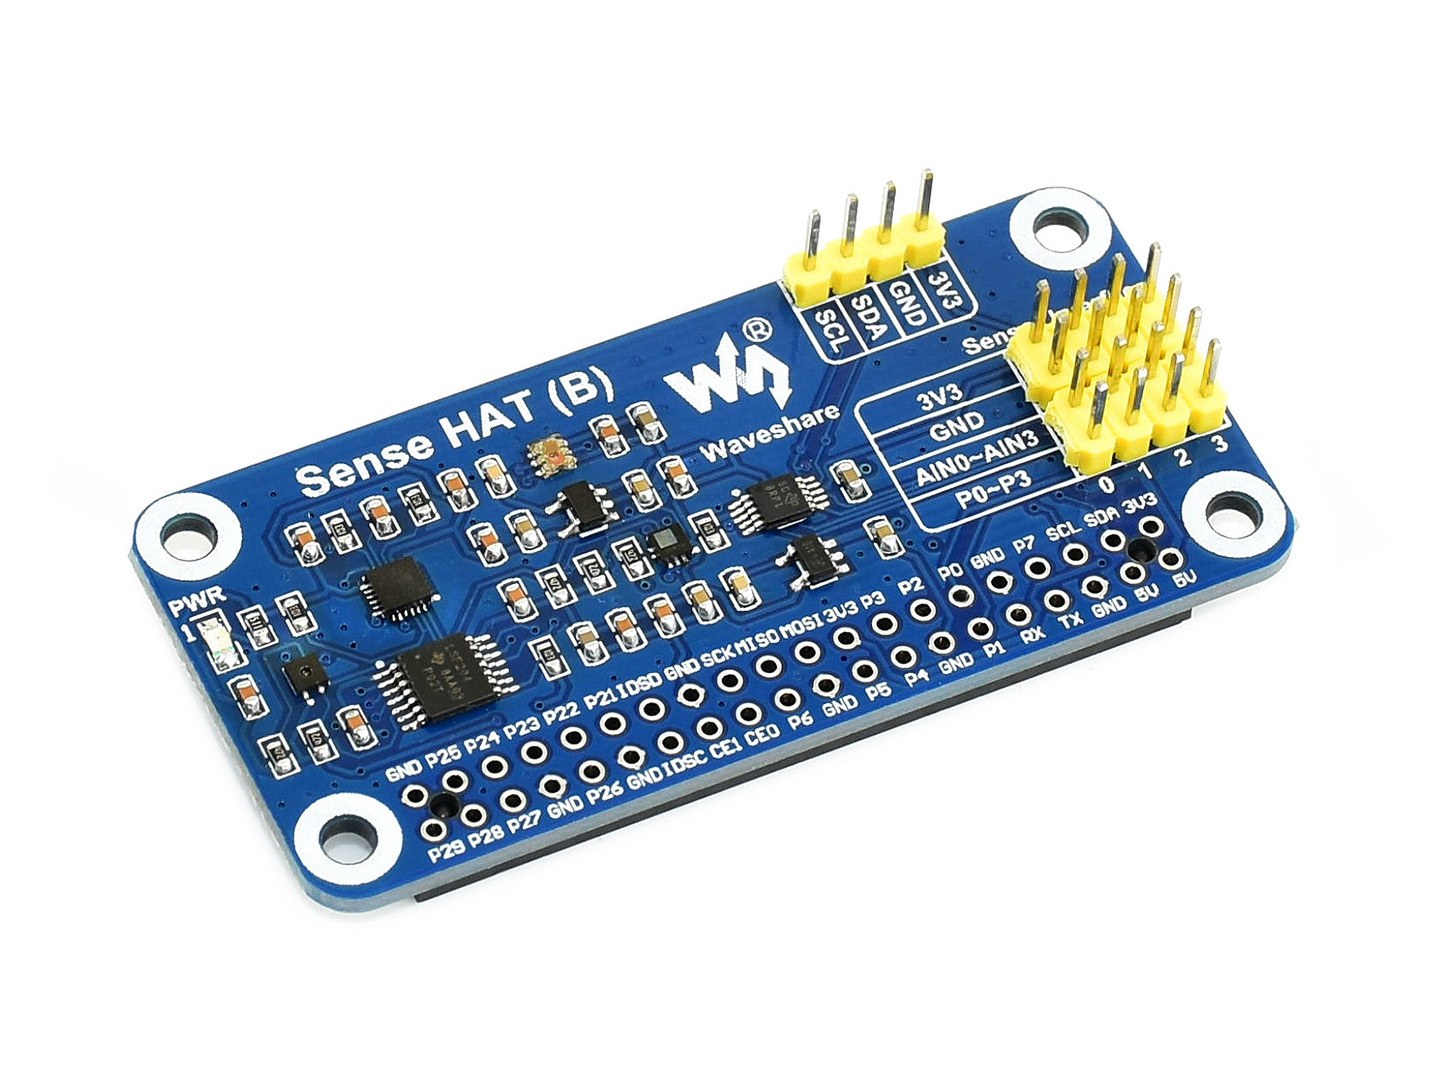
01 / Project overview
The Waveshare Sense HAT (B) includes an SHTC3 temperature/humidity sensor and an LPS22HB pressure sensor on I2C. Use the SHTC3 for the room-temperature channel; the pressure sensor’s temperature reading serves a different purpose. This project builds a local CSV log before adding a dashboard.
02 / Materials & software
| Item | What to check |
|---|---|
| Sense HAT (B) | This is the Waveshare B board, not the Raspberry Pi Sense HAT. |
| Raspberry Pi | Choose an OS and GPIO library supported by the example. |
| Header or cable | Keep the board correctly aligned. |
| Power and storage | A stable supply and a directory for daily logs. |
03 / Connections & first setup
Mount the board with power disconnected and enable I2C using the current Raspberry Pi OS configuration tools. Check the pin-1 orientation. The Pi can warm a board mounted directly above it; use the manufacturer’s supported separation method when evaluating ambient conditions.
04 / Build the project
- Read sensors separately
Run the SHTC3 and LPS22HB examples independently. Record their outputs and units. A single successful I2C scan does not prove both drivers are returning correct measurements.
- Create a combined record
Read the two sensors in a short acquisition cycle and assign one timestamp to the record. Preserve a per-sensor error state. If pressure fails, keep the valid temperature reading rather than dropping every channel.
- Write a daily CSV
Use a new file for each date and include units in the header. Append rows at a modest fixed interval. Close or flush the file deliberately so a normal program stop leaves readable data.
- Check placement effects
Compare a short run near the Pi with one in the intended mounting position. Note heat sources and airflow. Keep those notes with the data so a change in mounting is not mistaken for a climate trend.
- Review before automating
Inspect an entire day for gaps and implausible values. Once the manual run is reliable, configure the logger to start automatically using the OS’s normal service mechanism and keep its errors visible.
Suggested CSV schema
time_utc,shtc3_temperature_c,humidity_pct,pressure_hpa,status05 / Check the result
| Check | Expected behavior |
|---|---|
| Separate demos | Each sensor returns values before integration. |
| One sensor error | Other valid channels continue to be recorded. |
| Placement change | The log includes a note identifying the change. |
Troubleshooting. A rising temperature after startup may come from the Pi’s heat. Missing I2C devices suggest connection or configuration issues; intermittent read failures need driver and bus investigation. Avoid applying an arbitrary temperature correction before testing the physical placement.
06 / Sources & build notes
Prepared by PineMux from the official sources above. These are editorial build instructions; this project has not been bench-tested by PineMux. The cover shows reference hardware or a source project; image credit is provided above. Use the manufacturer’s revision-specific diagrams for exact wiring.